What it’s like to use Haskell

By Andy Friesen

Since early 2013, we at IMVU have used Haskell to build several of the REST APIs that power our service.

When the company started, we chose PHP as our application server language, in part, because the founders expected the website to only be a small part of the business!  IMVU was primarily about a downloadable 3D client.  We needed “a website or something” to give users a place to download our client from, but didn’t expect it would have to be much more than that. This shows that predicting the future is hard.
Years later, we have quite a lot of customers, and we primarily use PHP to serve them.  We’re big enough that we run multiple subteams on separate initiatives at the same time.  Performance is becoming important to us not just because it matters to our customers, but because it can easily make the difference between buying 4 servers and buying 40 servers to support some new feature.

So, early in 2012, we found ourselves ready to look for an alternative that would help us be more rigorous.  In particular, we were ready for the idea that sacrificing a tiny bit of short term, straight-line time to market might actually speed us up in the long run.

How We Got Here

I started learning Haskell in my spare time in part because Haskell seems like the exact opposite of PHP: Natively compiled, statically typed, and very principled.

My initial exploration left me interested in evaluating Haskell at real scale.  A year later, we did a live-fire test in which we taught multiple teammates Haskell while delivering an important new feature under a deadline.

Today, a lot of our backend code is still driven by PHP, but we have a growing amount of Haskell that powers newer features. The process has been exciting not only because we got to actually answer a lot of the questions that keep many people from choosing not to try Haskell, but also because it’s simply a better solution.

The experiment to start developing in Haskell took a lot of internal courage and dedication, and we had to overcome a number of, quite rational, concerns related to adopting a whole new language. Here are the main ones and how they worked out for us:

Scalability

The first thing we did was to replace a single service with a Haskell implementation.  We picked a service that was high-volume but was not mission critical.

We didn’t do any particular optimization of this new service, but it nevertheless showed excellent performance characteristics in the field.  Our little Haskell server was running on a pair of spare servers that were otherwise set for retirement, and despite this, each machine was handling about 20x as many requests as one of our high-spec PHP servers could manage.

Reliability

The second thing we did was to take our hands off the Haskell service and leave it running until it fell over.  It ran for months without intervention.

Training

After the reliability test, we were ready to try a live fire exercise, but we had to wait a bit for the right project.  We got our chance in early 2013.

The rules of the experiment were simple: Train 3 engineers to write the backend for an important new project and keep up with a separate frontend team.  Most of the code was to be new, so there was relatively little room for legacy complications.

We very quickly learned that we had also signed up for a lot of catch-up work to bring the Haskell infrastructure inline with what we’ve had for years in PHP.  We were very busy for awhile, but once we got this infrastructure out of the way, the tables turned and the front-end team became the limiting factor.

Today, training an engineer to be productive in our Haskell code is not much harder than training someone to be productive in our PHP environment.  People who have prior functional programming knowledge seem to find their stride in just a few days.

Testing

Correctness is becoming very important for us because we sometimes have to change code that predates every current developer.  We have enough users that mistakes become very costly, very quickly.  Solving these sorts of issues in PHP is sometimes achievable but always difficult.  We usually solve them with unit tests and production alerts, but these approaches aren’t sufficient for all cases.

Unit tests are incredible and great, but you’re always at the mercy of the level of discipline of every engineer at every moment. It’s easy to tell your teammates to write tests for everything, but this basically boils down to asking everyone to be at their very best every day.  People make mistakes and things slip through the cracks.

When using Haskell, we actually remove an entire class of defects that we have to write tests for. Thus, the number of tests we have to write is smaller, and thus there are fewer cases we can forget to write tests for.

We like unit testing and test-driven development (TDD) at IMVU and we’ve found that Haskell is better with TDD, but also that TDD is better with Haskell.  It takes fewer tests to get the same degree of reliability out of Haskell.  The static verification takes care of quite a lot of error checking that has to be manually implemented (or forgotten) in PHP.  The Haskell QuickCheck tool is also a wonderful help for developers.
The way Haskell separates pure computations from side effects let us build something that isn’t practical with other languages: We built a custom monad that lets us “switch off” side effects in our tests.  This is incredible because it means that trying to escape the testing sandbox breaks compilation. While we have had to fight intermittent test failures for eight years in PHP (and at times have had multiple engineers simultaneously dedicated to the problem of test intermittency,) our unit tests in Haskell cannot intermittently fail.

Deployment

Deployment is great. At IMVU, we do continuous deployment, and Haskell is no exception. We build our application as a statically linked executable, and rsync it out to our servers. We can also keep old versions around, so we can switch back, should a deployment result in unexpected errors.

I wouldn’t write an OS kernel in it, but Haskell is way better than PHP as a systems language. We needed a Memcached client for our Haskell code, and rather than try to talk to a C implementation, we just wrote one in Haskell.  It took about a half day to write and performs really well. And, as a side effect, if we ever read back some data we don’t expect from memcached (say, because of an unexpected version change) then Haskell will automatically detect and reject this data.

We’ve consistently found that we unmake whole classes of bugs by defining new data types for concepts to wrap primitive types like integers and strings.  For instance, we have two lines of code that say that “customer IDs” and “product IDs” are represented to the hardware as numbers, but they are not mutually convertible.  Setting up these new types doesn’t take very much work and it makes the type checker a LOT more helpful. PHP, and other popular dynamic server languages like Javascript or Ruby, make doing the same very hard.

Refactoring is a breeze.  We just write the change we want and follow the compile errors.  If it builds, it almost certainly also passes tests.

Not All Sunshine and Rainbows

Resource leaks in Haskell are nasty.  We once had a bug where an unevaluated dictionary was the source of a space leak that would eventually take our servers down.  We also ran into an issue where an upstream library opened /dev/urandom for randomness, but never closed the file handle.  These issues don’t happen in PHP, with its process-per-request model, and they were more difficult to track down and resolve than they would have been in C++.

The Haskell package manager, Cabal, ended up getting in the way of our development. It lets you specify version ranges of particular packages you want, but it’s important for everyone on the team to have exactly the same versions of every package.  That means controlling transitive dependencies, and Cabal doesn’t really offer a way to handle this precisely. For a language that is so very principled on type algebra, it’s surprising that the package manager doesn’t follow suit regarding package versioning. Instead, we use Cabal for basic package installation, and a custom build tool (written in Haskell.)

Hiring

I’ll admit that I was very worried that we wouldn’t be able to hire great people if our criteria was expertise in an uncommon language without a comparatively sparse industrial track record, but the honest truth is that we found a great Haskell hacker in the Bay area after about 4 days of looking.

We had a chance to hire him because we were using Haskell, not in spite of it.

Final Thoughts

While it’s usually difficult to objectively measure things like choice of programming language or softwarestack, we’re now seeing fantastic, obvious productivity and efficiency gains.  Even a year later, all the Haskell code we have runs on just a tiny number of servers and, when we have to make changes to the code, we can do so quickly and confidently.

Charming Python: How to actually close a socket by calling shutdown() before calling close()

By Eric Hohenstein

You may never have to use the Python low-level socket interface but if you ever do, here’s a tip regarding some surprising Python socket behavior that might help you.

The standard Python library has a “socket” module written in Python that wraps an underlying “_socket” module written in C that wraps OS level sockets. Together, these expose a cross-platform Berkeley socket-like interface to Python applications. I say Berkeley socket-like because the socket functions are exposed on an object rather than global free-functions. The surprise with this interface is that the close() function of the socket object does not close the socket. Instead, it de-references it, allowing garbage collection to eventually close the OS-level socket. If you only use the close() method on a socket, the socket will continue using both client and server resources until it is garbage collected. Worse, if the other end is continuing to send data to the locally discarded socket, it may block when the receive window of local socket fills up. Even worse than that, if the software handling the other end of the socket is written in erlang and 0 window packets are dropped somewhere in between (for instance because of overly aggressive firewall rules), the other end may block until the socket gets garbage collected even if the socket is configured to immediately time out send operations if they would block.

The solution is to first call shutdown() on the socket before calling close(). You have to be careful doing this if the socket is being read/written by multiple threads simultaneously but down that path lies madness, so don’t do that.

The Python documentation for the socket module actually does briefly mention this but doesn’t really give much of an explanation as to why it’s necessary. Really, the Python documentation on the subject is correct in that calling shutdown is better form. However, in cases where you are sure that the application state of the connection is no longer valid, it should be possible to bypass the shutdown and close the socket to simply free its resources immediately.

Why is it necessary to call shutdown() before close()? Let’s take a look at the socket.py module from the standard Python library. These code snippets are all taken from Python 2.6 source, though I’ve confirmed that Python 2.7 and Python 3.0 behave similarly. First, socket.py imports everything from _socket, which includes a class called socket:

import _socket

from _socket import * 

Then, it saves a reference to _socket.socket called _realsocket

_realsocket = socket

Then it defines a list of functions that will be exposed from the real socket object to the wrapper class (see below):

_socketmethods = (         

          ‘bind’, ‘connect’, ‘connect_ex’, ‘fileno’, ‘listen’,         
          ‘getpeername’, ‘getsockname’, ‘getsockopt’, ‘setsockopt’,         
          ‘sendall’, ‘setblocking’,         
          ‘settimeout’, ‘gettimeout’, ‘shutdown’) 

Note that ‘close’ is not in that list but ‘shutdown’ is.

Then it defines a _closedsocket class that will fail all operaitons:

class _closedsocket(object):   

        __slots__ = []   
        def _dummy(*args):       
                raise error(EBADF, ‘Bad file descriptor’)   
         # All _delegate_methods must also be initialized here.   
          send = recv = recv_into = sendto = recvfrom = recvfrom_into = _dummy   

          __getattr__ = _dummy

Then, it defines a class called _socketobject. Note the comment before the start of this class:

# Wrapper around platform socket objects. This implements

# a platform-independent dup() functionality. The

# implementation currently relies on reference counting

# to close the underlying socket object.

class _socketobject(object):    

       __doc__ = _realsocket.__doc__    
       __slots__ = [“_sock”, “__weakref__”] + list(_delegate_methods)    
       def __init__(self, family=AF_INET, type=SOCK_STREAM, proto=0, _sock=None):       
                if _sock is None:           
                      _sock = _realsocket(family, type, proto)       
                self._sock = _sock       
                for method in _delegate_methods:           
                        setattr(self, method, getattr(_sock, method)) 

Within the _socketobject class, it defines a method for each of the functions exposed by the _socket class:

             _s = (“def %s(self, *args): return self._sock.%s(*args)\n\n”         

            “%s.__doc__ = _realsocket.%s.__doc__\n”)   
             for _m in _socketmethods:       
                      exec _s % (_m, _m, _m, _m)   
             del _m, _s 

Remember that close was not in the _socketmethods list. Here’s the close method of the _socketobject class:

             def close(self):       

                     self._sock = _closedsocket()       
                     dummy = self._sock._dummy       
                     for method in _delegate_methods:           
                             setattr(self, method, dummy)   
              close.__doc__ = _realsocket.close.__doc__ 

Assigning a new value to self._sock de-references the real socket object, allowing it to be garbage collected. It then exposes the _socketobject class as socket:

socket = SocketType = _socketobject

Client networking code using the Python socket library would create a socket like so:

import socket

sock = socket.socket() 

which will create a socket._socketobject instance that has a _sock member which is a _socket.socket instance. After connecting the socket to a remote endpoint, calling close() just assigns the _sock member to an instance of _closesocket, allowing Python to eventually garbage collect the original _socket.socket object. After the previous code, the following will “leak” the OS socket for some arbitrary amount of time:

sock.connect((“www.foobar.com“, 80))

sock.close() 

Looking at the C code in _socketmodule.c, there is a close() method defined on the _socket.socket class but there is no code in socket.py that will call it:

static PyObject *

sock_close(PySocketSockObject *s)
{
SOCKET_T fd; 
if ((fd = s->sock_fd) != -1) {
s->sock_fd = -1;
Py_BEGIN_ALLOW_THREADS
(void) SOCKETCLOSE(fd);
Py_END_ALLOW_THREADS
}
Py_INCREF(Py_None);
return Py_None;
}  

Actually, there is code in socket.py that will call this function but it’s in the socket._fileobject class that is returned from the socket._socketobject makefile() function which typical networking code will likely not use.

If the close() method of socket._socketobject deferred to the _socket.socket close() method, calling close() on a socket.socket object would actually close the socket (if it was open). Since it does not, calling shutdown() is the only way to close the socket immediately. I’ll not go into the difference between close() and shutdown() here since it’s fairly complex and mostly unimportant but a simplified explanation is that shutdown() may wait until any unsent data has been flushed to the network (although it may not) and close() will not.

Here’s the implementation of _socket.socket shutdown() function:

static PyObject *

sock_shutdown(PySocketSockObject *s, PyObject *arg)
{
int how;
int res; 
how = PyInt_AsLong(arg);
if (how == -1 && PyErr_Occurred())
return NULL;
Py_BEGIN_ALLOW_THREADS
res = shutdown(s->sock_fd, how);
Py_END_ALLOW_THREADS
if (res < 0)
return s->errorhandler();
Py_INCREF(Py_None);
return Py_None;
}  

Calling shutdown() on an instance of socket._socketobject will actually shutdown the OS level socket before it is garbage collected. If the _socket.socket object is not already shutdown or closed, it will eventually be closed when it’s garbage collected:


static void

sock_dealloc(PySocketSockObject *s)
{
if (s->sock_fd != -1)
(void) SOCKETCLOSE(s->sock_fd);
Py_TYPE(s)->tp_free((PyObject *)s);
} 

The conclusion is that Python sockets should always be closed by first calling shutdown() and then calling close().

Efficient and Scalable Off-Site Backup to Amazon Glacier

By Ted Reed

The strength of IMVU is our large catalog of User-Generated Content (UGC). With more than ten million items in our virtual catalog, losing our UGC would be crippling to our business.  We in the Operations Team take the preservation of this data seriously. We recently upgraded our aging UGC backup system to use Amazon Glacier as the storage medium. This post will briefly explain the old backup system before detailing the new one.

In The Beginning

We store our UGC in a MogileFS instance, a system for cheap and efficient storage of files across commodity hardware. Our offsite backups originally took the form of USB drives onto which a process would copy the files as they were written to Mogile. As each drive filled up, we would then transport it from our colocation facility to a fire safe in our office. To cover the period of time when the disk was still being written to, we would keep a synced copy of the disk on a machine in a server closet in our offices. This copy would then be deleted once the USB disk had been safely stored.

As time went on, the rate at which our customers were adding photos or uploading products to our catalog grew and grew. We also started permitting higher-quality photos and made it easier to upload and manage them. In order to compensate for the increase in growth, we started buying larger and larger USB drives. This past summer we reached the point where we had the biggest USB drives we could reasonably get and we were still filling them up in about a week. Each time a drive filled up, one of us had to drive out to the facility to retrieve it.

Auditing the data also became woefully inconvenient, as the number of individual drives one had to juggle during the audit skyrocketed. It was an annoyingly manual process, even with helper scripts to manage everything but plugging and unplugging drives. Additionally, annoyingly manual processes tend to not get done as often as we ought to.

Enter Amazon Glacier

We spent some time looking over options for better off-site backups. We talked to many vendors and even for those who could handle our “monumental amount of data” (actual term used by a vendor who shall remain nameless). The quotes left us wondering if we might not be better off just putting some cheap servers in another data center somewhere.

While we were evaluating these options in late August 2012, Amazon announced Glacier, an “extremely low-cost storage service” intended for long-term archival of infrequently-accessed data. At just one cent per gigabyte per month, it handily beat out every other vendor we’d seen in terms of price. We poked around and tested the service out, and found it to be right up our alley, although the pricing was annoyingly confusing. (I ended up writing a small Haskell program to re-implement the math from their FAQ. It rounds in weird places.)

The Backup Process

The backup process begins with a Perl daemon which manages worker pools of Fetchers and Uploaders. The master process figures out which files need to be backed up and hands work off to the Fetchers, which talk to Mogile and pull the file down to a local directory. Once a directory has about 25 MB of files, it’s closed off and handed to an Uploader. The Uploader will then tar the directory and send the tar to Glacier.

It’s worth pointing out here that the 25 MB bundling is actually pretty important if you don’t want to pay a great deal of money. Glacier charges five cents per thousand uploads. My first tests ignored that cost and we pretty quickly ran up an unexpectedly large bill. After some analysis, we found that 25 MB was about right as a middle point between cost and flexibility. This middle point is likely to differ for your use case and budget. The state of the backup process is stored in a MySQL database, which has tables for archives and the files that go into them. We record roughly the same information that Mogile does about each file so that we can accurately restore it if the file is accidentally deleted from Mogile. For each archive, we store both its size as well as information about where to find it (region/vault/id). We also have tables to record information about backup failures for later investigation.

Restoration

The restoration process begins with a simple front-end script, which can take a source and destination. The source can be in terms of Mogile ID, Mogile Domain/Key, or one of our URLs (the latter two are dereferenced to Mogile ID). The destination can be Mogile itself, a local file, or S3. There’s also a batch mode which takes input where each line represents one source and one destination. The script will record each file to restore in the database. It will then issue requests to Glacier to retrieve the archives needed to restore the files, unless there is already an active and uncompleted request for the same archive.

Elsewhere in our network, we have a daemon which sits and listens to an SQS queue tied to the SNS topic for restoration. The notification will include the database ID for the restore request. The daemon will pull the information needed to do the restoration and then clear it afterwards.

Auditing and Validation

One side benefit of a backup system that doesn’t involve managing disks is that we can automate testing the backups and our restoration process. There are two aspects that we want to test. First, we want to prove that the backups are intact and accurate. Second, we want to prove that we are able to restore the data. Glacier permits you to pull up to 5% of your total data per month, presumably for purposes such as these. You still need to pay bandwidth egress charges if the data leaves AWS, which informed our design for the automated audit process.

In order to audit the backups, there’s a cron on our side which runs hourly and selects a random sampling of one millionth of the archives we’ve uploaded. If we had 3,000,000 archives, we’d audit 3 per hour. For each archive, this cron pulls the files from Mogile and generates md5sums. It issues a request to Glacier, with a different SNS topic than the one we use for ordinary restoration. It then uploads the md5sums as a file to an EC2 micro instance which runs a daemon listening for that SNS topic. As the archives become available, the daemon does the same md5sum generation on the Glacier data, comparing it to the list uploaded beforehand. If there is a discrepancy, it sends an email to a mailing list that we check at least daily.

To handle verifying the restoration path, there is a smaller monthly process. It will generate a list of 10 random files and use our normal restoration tool to restore them to test buckets in both Mogile and S3. If the files haven’t been restored within 24 hours, a notification goes to the same mailing list as for audit failures.

In The End

We’re still pushing our historical data into Glacier, but this project is already looking pretty successful. We’ve been adding new data since last November, and are in the process of checking through everything to gain a full trust in the system before we finally pull the plug on the old system and build a mighty throne out of the USB drives.

The backup process was mostly optimized to be able to push these historical files up to Amazon in a reasonable timeframe. As a result, the process which backs up our real-time uploads is quite fast with plenty of room to grow as our usage scales up. Files added to Mogile are in the backup process within seconds, and are typically in Glacier within less than a minute. I looked at our system during peak time for an example, and found that files were in Glacier 35 seconds after being uploaded to us by a user. Knowing this gives me great peace of mind that our UGC will be safe in the event a disaster strikes.

What about other forms of backup? We briefly looked at storing our offsite database backups in Glacier, but decided against this. Any data you put into Glacier will be billed for at least three months. Adding daily backups and then deleting some of them later makes for a rather expensive solution. There’s also little to gain as the process which moves the database backups to our office isn’t nearly as painful as our older UGC backup process was.

Continuous Monitoring: Real-time statistics for a thousand servers and the application they serve

By Jon Watte, Technical Director, IMVU.com 
Image

At IMVU, we push code to production fifty times a day. Each time an engineer finishes a task, the code goes through a large battery of unit tests, and when it passes, we deploy it on our servers right away. This makes the feedback loop immediate: If something is wrong, we hear about it and can fix it while the context is still fresh in the mind of the engineer.

An important part of this process is the “immune system.” The immune system monitors the status of the entire application, and detects abrupt changes. If these abrupt changes are bad enough, and closely enough correlated with a recent code deployment, that code deployment is rolled back, and the engineer in question sent links to graphs and error logs to go look at to figure out the problem.

For a long time, we used rrdtool with scripts to scrape counter values out of memcached to capture data, and cacti to plot that data into graphs. This was an easy way get get started when IMVU was small, and it has scaled to the size we’re at now. Two years ago, the system started showing its age. A year ago, we decided to do something about it. The problems we wanted to solve were:

1) The system we had only collected data at 5 minute intervals. This is way too slow to quickly detect problems after a bad code push. Bad code pushes are rare, but we want them to impact customers as briefly as possible.

2) The system we had would aggregate data as “average” over time, to keep coarser data available for a longer time. But this means that we lose useful resolution. What was the swing of the data within each “bucket” of measurements? What was the min, and the max?

3) The retention times for the data were too short. To compare if the system is mis-behaving right now, or if it’s just normal high load for a week-end, we need accurate data from a week ago as a baseline.

4) The system that relied on metrics to be written into memcache, and then scraped back out into rrd files by cacti, was running out of steam, and we often had time intervals with missing data for many counters.

To solve these problems, we went looking for other counter management solutions. We tried a large number, wrote off a bunch, and then settled on “Graphite,” which our friends over at Etsy seemed to recommend highly. However, Graphite was still not quite right — it would still only allow a single aggregation function when aggregating metrics over time, and the built-in storage back-end had some performance problems, largely traced to the distribution model of “use NFS.”

So, we started writing our own back-end for the nice Graphite graphing front-end. We made the back-end fit into Graphite’s expectations, and exposed the different data from a single metric as separate sub-counters. For each data point in a graph, we could get the average, sample count, standard deviation, minimum, and maximum. Getting there required pretty heroic efforts, and pretty nasty hacks, though — the internals of Graphite simply weren’t made to support this use case. Also, Graphite used server-side rendering, which meant that just a few engineers keeping a dashboard of a dozen counters on their screen, refreshing every 10 seconds, would overload the machine collecting the metrics.

At some point, enough was enough, and we took the back-end we’d developed, and wrote our own front-end. This front-end is a HTML5 application using client-side JavaScript for rendering, thus offloading the metrics server. It also uses HTTP for data transport, thus lending itself well to various kinds of clients — including web caching if needed!

Finally, to solve the intermittent data problem, we made the system capable of forwarding incoming data in a graph. An agent can run on each server, and receive local data, which it then forwards to the master database. Should the agent connection go down, the data is buffered while the agent attempts to re-connect.

Today, we’re releasing this (both back-end and front-end) on GitHub to the open source world as our contribution to operations and engineering teams everywhere. If you have a large number of counters to track, and want richer data than a “simple” aggregation function per data point, I encourage you to have a look, starting with the wiki:

https://github.com/imvu-open/istatd/wiki

The back-end application is written in C++ with boost::asio for threading and networking, and currently keeps half a million counter files, each updated every 10 seconds, on a mid-range Dell server with raid5 SSD drives. Currently, there is build and packaging support for Ubuntu 10.04 LTS, although any reasonable UNIX with GCC should be supported. Give it a spin, and let us know what you think!

Gephi Plugins Developers Workshop at IMVU

by Paco Nathan

At IMVU, the Data team often works with large data sets which represent customer interactions across social graphs. This kind of data cannot be explored very well using relational databases, such as MySQL. Instead, we rely on other tools for analyzing social graphs.

One tool which we really like is called Gephi, an open source platform for visualization and analysis of graphs. Our team uses Gephi as an interactive UI for exploring relationships and patterns in graphs. We also use it for calculating social graph metrics and other statistics which help us to characterize large graphs. One favorite feature in Gephi is how readily it can be extended by writing plugins.

We’ve received much appreciated help and guidance from the Gephi developer community. Now we are glad to be able to host the first Gephi workshop about developing plugins. Bring your laptop, install the required software from sources provided, and work with mentors to learn how to write your own Gephi plugins! And get to network with other people in the Gephi developer community.

To RSVP, please click through the Meetup.com link below.

Title: Gephi Plugins Developers Workshop

Organizers: Mathieu Bastian and Paco Nathan

Date and Time: Thursday, October 6, 2011, 7:00-9:30pm

Location: IMVU, Inc.. 100 W. Evelyn Ave #110, Mountain View, CA

Cost: No cost

Food and drinks: Food, drinks, and wifi will be provided

Agenda: This is the first Gephi workshop dedicated to Gephi Plugins developers! Come and learn how to write your first Gephi plugins and ask questions.

The workshop will start with a 1-hour presentation of Gephi’s architecture and the different types of plugins that can be written with examples. Details about Gephi’s API, code examples and best practices will be presented in an interactive “live coding” way. The Gephi Toolkit will also be covered in details. The second part of the workshop will be dedicated to help individuals with their projects and answer questions. Depending on the audience’s needs we can discuss plugin design, how to code UI, databases, toolkit, data sources or any plug-in idea you have.

Gephi is modular software and can be extended with plugins. Plugins can add new features like layout, filters, metrics, data sources, etc. or modify existing features. Gephi is written in Java so anything that can be used in Java can be packaged as a Gephi plugin! Visit the Plugins Portal on the wiki and follow the tutorials.

Link to event on meetup.com: Gephi Plugins Developers Workshop

Tracing Leaks in Python: Find the Nearest Root

By Chad Austin


Garbage Collection Doesn’t Mean You Can Ignore Memory Altogether…

Garbage collection removes a great deal of burden from programming. In fact, garbage collection is a critical language feature for all languages where abstractions such as functional closures or coroutines are common, as they frequently create reference cycles.

IMVU is a mix of C++ and Python. The C++ code generally consists of small, cohesive objects with a clear ownership chain. An Avatar SceneObject owns a ModelInstance which owns a set of Meshes which own Materials which own Textures and so on… Since there are no cycles in this object graph, reference-counting with shared_ptr suffices.

The Python code, however, is full of messy object cycles. An asynchronous operation may hold a reference to a Room, while the Room may be holding a reference to the asynchronous operation. Often two related objects will be listening for events from the other. While Python’s garbage collector will happily take care of cycles, it’s still possible to leak objects.

Imagine these scenarios:

  • a leaked or living C++ object has a strong reference to a Python object.
  • a global cache has a reference to an instance’s bound method, which implicitly contains a reference to the instance.
  • two objects with __del__ methods participate in a cycle with each other, and Python refuses to decide which should destruct first

To detect these types of memory leaks, we use a LifeTimeMonitor utility:

a = SomeObject()
lm = LifeTimeMonitor(a)
del a
lm.assertDead() # succeeds

b = SomeObject()
lm = LifeTimeMonitor(b)
lm.assertDead() # raises ObjectNotDead

We use LifeTimeMonitor’s assertDead facility at key events, such as when a user closes a dialog box or 3D window. Take 3D windows as an example. Since they’re the root of an entire object subgraph, we would hate to inadvertently leak them. LifeTimeMonitor’s assertDead prevents us from introducing an object leak.

It’s good to know that an object leaked, but how can you determine why it can’t be collected?

Python’s Garbage Collection Algorithm

Let’s go over the basics of automatic garbage collection. In a garbage-collected system there are objects and objects can reference each other. Some objects are roots; that is, if an object is referenced by a root, it cannot be collected. Example roots are the stacks of live threads and the global module list. The graph formed by objects and their references is the object graph.

In SpiderMonkey, Mozilla’s JavaScript engine, the root set is explicitly-managed. SpiderMonkey’s GC traverses the object graph from the root set. If the GC does not reach an object, that object is destroyed. If C code creates a root object but fails to add it to the root set, it risks the GC deallocating the object while it’s still in use.

In Python however, the root set is implicit. All Python objects are ref-counted, and any that can refer to other objects — and potentially participate in an object cycle — are added to a global list upon construction. Each GC-tracked object can be queried for its referents. Python’s root set is implicit because anyone can create a root simply by incrementing an object’s refcount.

Since Python’s root set is implicit, its garbage collection algorithm differs slightly from SpiderMonkey’s. Python begins by setting GCRefs(o) to CurrentRefCount(o) for each GC-tracked PyObject o. Then it traverses all referents r of all GC-tracked PyObjects and subtracts 1 from GCRefs(r). Then, if GCRefs(o) is nonzero, o is an unknown reference, and thus a root. Python traverses the now-known root set and increments GCRefs(o) for any traversed objects. If any object o remains where GCRefs(o) == 0, that object is unreachable and thus collectible.

Finding a Path From the Nearest Root to the Leaked Object

Now that we know how Python’s garbage collector works, we can ask it for its set of roots by calculating GCRefs(o) for all objects o in gc.get_objects(). Then we perform a breadth-first-search from the root set to the leaked object. If the root set directly or indirectly refers to the leaked object, we return the path our search took.

Sounds simple, but there’s a catch! Imagine that the search function has signature:

PyObject* findPathToNearestRoot(PyObject* leakedObject);

leakedObject is a reference (incremented within Python’s function-call machinery itself) to the leaked object, making leakedObject a root!

To work around this, change findPathToNearestRoot so it accepts a singleton list containing a reference to the leaked object. findPathToNearestRoot can borrow that reference and clear the list, ensuring that leakedObject has no untracked references.

findPathToNearestRoot will find paths to expected Python roots like thread entry points and module objects. But, since it directly mirrors the behavior of Python’s GC, it will also find paths to leaked C references! Obviously, it can’t directly point you to the C code that leaked the reference, but the reference path should be enough of a clue to figure it out.

The Code

template<typename ArgType>
void traverse(PyObject* o, int (*visit)(PyObject* visitee, ArgType* arg), ArgType* arg) {
    if (Py_TYPE(o)->tp_traverse) {
        Py_TYPE(o)->tp_traverse(o, (visitproc)visit, arg);
    }
}

typedef std::map<PyObject*, int> GCRefs;

static int subtractKnownReferences(PyObject* visitee, GCRefs* gcrefs) {
    if (gcrefs->count(visitee)) {
        Assert(PyObject_IS_GC(visitee));
        --(*gcrefs)[visitee];
    }
    return 0;
}

typedef int Backlink; // -1 = none

typedef std::vector< std::pair<Backlink, PyObject*> > ReferenceList;
struct Referents {
    std::set<PyObject*>& seen;
    Backlink backlink;
    ReferenceList& referenceList;
};

static int addReferents(PyObject* visitee, Referents* referents) {
    if (!referents->seen.count(visitee) && PyObject_IS_GC(visitee)) {
        referents->referenceList.push_back(std::make_pair(referents->backlink, visitee));
    }
    return 0;
}

static Backlink findNextLevel(
    std::vector<PyObject*>& chain,
    const ReferenceList& roots,
    PyObject* goal,
    std::set<PyObject*>& seen
) {
    if (roots.empty()) {
        return -1;
    }

    for (size_t i = 0; i < roots.size(); ++i) {
        if (roots[i].first != -1) {
            if (goal == roots[i].second) {
                chain.push_back(goal);
                return roots[i].first;
            }
            seen.insert(roots[i].second);
        }
    }

    ReferenceList nextLevel;
    for (size_t i = 0; i < roots.size(); ++i) {
        Referents referents = {seen, i, nextLevel};
        traverse(roots[i].second, &addReferents, &referents);
    }

    Backlink backlink = findNextLevel(chain, nextLevel, goal, seen);
    if (backlink == -1) {
        return -1;
    }

    chain.push_back(roots[backlink].second);
    return roots[backlink].first;
}

static std::vector<PyObject*> findReferenceChain(
    const std::vector<PyObject*>& roots,
    PyObject* goal
) {
    std::set<PyObject*> seen;
    ReferenceList unknownReferrer;
    for (size_t i = 0; i < roots.size(); ++i) {
        unknownReferrer.push_back(std::make_pair<Backlink>(-1, roots[i]));
    }
    std::vector<PyObject*> rv;
    // going to return -1 no matter what: no backlink from roots
    findNextLevel(rv, unknownReferrer, goal, seen);
    return rv;
}

static object findPathToNearestRoot(const object& o) {
    if (!PyList_Check(o.ptr()) || PyList_GET_SIZE(o.ptr()) != 1) {
        PyErr_SetString(PyExc_TypeError, "findNearestRoot must take a list of length 1");
        throw_error_already_set();
    }

    // target = o.pop()
    object target(handle<>(borrowed(PyList_GET_ITEM(o.ptr(), 0))));
    if (-1 == PyList_SetSlice(o.ptr(), 0, 1, 0)) {
        throw_error_already_set();
    }

    object gc_module(handle<>(PyImport_ImportModule("gc")));
    object tracked_objects_list = gc_module.attr("get_objects")();
    // allocating the returned list may have run a GC, but tracked_objects won't be in the list

    std::vector<PyObject*> tracked_objects(len(tracked_objects_list));
    for (size_t i = 0; i < tracked_objects.size(); ++i) {
        object to = tracked_objects_list[i];
        tracked_objects[i] = to.ptr();
    }
    tracked_objects_list = object();

    GCRefs gcrefs;

    // TODO: store allocation/gc count per generation

    for (size_t i = 0; i < tracked_objects.size(); ++i) {
        gcrefs[tracked_objects[i]] = tracked_objects[i]->ob_refcnt;
    }

    for (size_t i = 0; i < tracked_objects.size(); ++i) {
        traverse(tracked_objects[i], subtractKnownReferences, &gcrefs);
    }

    // BFS time

    std::vector<PyObject*> roots;
    for (GCRefs::const_iterator i = gcrefs.begin(); i != gcrefs.end(); ++i) {
        if (i->second && i->first != target.ptr()) { // Don't count the target as a root.
            roots.push_back(i->first);
        }
    }
    std::vector<PyObject*> chain = findReferenceChain(roots, target.ptr());

    // TODO: assert that allocation/gc count per generation didn't change

    list rv;
    for (size_t i = 0; i < chain.size(); ++i) {
        rv.append(object(handle<>(borrowed(chain[i]))));
    }

    return rv;
}

Extracting Color and Transparency from Flash

By Chad Austin

For clarity, I slightly oversimplified my previous discussion on efficiently rendering Flash in a 3D scene. The sticky bit is extracting transparency information from the Flash framebuffer so we can composite the overlay into the scene.

Flash does not give you direct access to its framebuffer. It does, with IViewObject::Draw, allow you to composite the Flash framebuffer onto a DIB section of your choice.

Remembering your Porter-Duff, composition of source over dest is:

Color = SourceColor * SourceAlpha + DestColor * (1 – SourceAlpha)

If the source color is premultiplied, you get:

Color = SourceColor + DestColor * (1 - SourceAlpha)

Assuming we want premultiplied color and alpha from Flash for efficient rendering in the 3D scene, applying the above requires solving for FlashAlpha and FlashColor:

RenderedColor = FlashColor * FlashAlpha + DestColor * (1 - FlashAlpha)

RenderedColor = FlashColor * FlashAlpha + DestColor - DestColor * FlashAlpha

RenderedColor - DestColor = FlashColor * FlashAlpha - DestColor * FlashAlpha

RenderedColor - DestColor = FlashAlpha * (FlashColor - DestColor)

FlashAlpha = (RenderedColor - DestColor) / (FlashColor - DestColor)

If FlashColor and DestColor are equal, then FlashAlpha is undefined. Intuitively, this makes sense. If you render a translucent black SWF on a black background, you can’t know the transparency data because all of the pixels are still black. This doesn’t matter, as I’ll show in a moment.

FlashColor is trivial:

RenderedColor = FlashColor * FlashAlpha + DestColor * (1 - FlashAlpha)

RenderedColor - DestColor * (1 - FlashAlpha) = FlashColor * FlashAlpha

FlashColor = (RenderedColor - DestColor * (1 - FlashAlpha)) / FlashAlpha

FlashColor is undefined if FlashAlpha is 0. Transparency has no color.

What do these equations give us? We know RenderedColor, since it’s the result of calling IViewObject::Draw. We have control over DestColor, since we configure the DIB Flash is drawn atop. What happens if we set DestColor to black (0)?

FlashColor = (RenderedColorOnBlack) / FlashAlpha

What happens if we set it to white (1)?

FlashColor = (RenderedColorOnWhite - (1 - FlashAlpha)) / FlashAlpha

Now we’re getting somewhere! Since FlashColor and FlashAlpha are constant, we can define a relationship between FlashAlpha and RenderedColorOnBlack and RenderedColorOnWhite:

(RenderedColorOnBlack) / FlashAlpha = (RenderedColorOnWhite - (1 - FlashAlpha)) / FlashAlpha

RenderedColorOnBlack = RenderedColorOnWhite - 1 + FlashAlpha

FlashAlpha = RenderedColorOnBlack - RenderedColorOnWhite + 1

FlashAlpha = RenderedColorOnWhite - RenderedColorOnBlack

So all we have to do is render the SWF on a white background and a black background and subtract the two to extract the alpha channel.

Now what about color? Just plug the calculated FlashAlpha into the following when rendering on black.

FlashColor = (RenderedColor - DestColor * (1 - FlashAlpha)) / FlashAlpha

FlashColor = RenderedColorOnBlack / FlashAlpha

Since we want premultiplied alpha:

FlashColor = RenderedColorOnBlack

Now that we know FlashColor and FlashAlpha for the overlay, we can copy it into a texture and render the scene!

Efficiently Rendering Flash in a 3D Scene

By Chad Austin

In my previous post, I talked about how to embed Flash into your desktop application, for UI flexibility and development speed. This time, I’ll discuss efficient rendering into a 3D scene.

Rendering Flash as a 3D Overlay (The Naive Way)

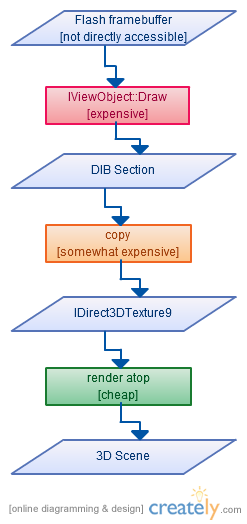
At first blush, rendering Flash on top of a 3D scene sounds easy. Every frame:

  1. Create a DIB section the size of your 3D viewport
  2. Render Flash into the DIB section with IViewObject::Draw
  3. Copy the DIB section into an IDirect3DTexture9
  4. Render the texture on the top of the scene

Ta da! But your frame rate dropped to 2 frames per second? Ouch. It turns out this implementation is horribly slow. There are a couple reasons.

First, asking the Adobe flash player to render into a DIB isn’t a cheap operation. In our measurements, drawing even a simple SWF takes on the order of 10 milliseconds. Since most UI doesn’t animate every frame, we should be able to cache the captured framebuffer.

Second, main memory and graphics memory are on different components in your computer. You want to avoid wasting time and bus traffic by unnecessarily copying data from the CPU to the GPU every frame. If only the lower-right corner of a SWF changes, we should limit our memory copies to that region.

Third, modern GPUs are fast, but not everyone has them. Let’s say you have a giant mostly-empty SWF and want to render it on top of your 3D scene. On slower GPUs, it would be ideal if you could limit your texture draws to the region of the screen that are non-transparent.

Rendering Flash as a 3D Overlay (The Fast Way)

Disclaimer: I can’t take credit for these algorithms. They were jointly developed over years by many smart engineers at IMVU.

First, let’s reduce an embedded Flash player to its principles:

  • Flash exposes an IShockwaveFlash [link] interface through which you can load and play movies.
  • Flash maintains its own frame buffer. You can read these pixels with IViewObject::Draw.
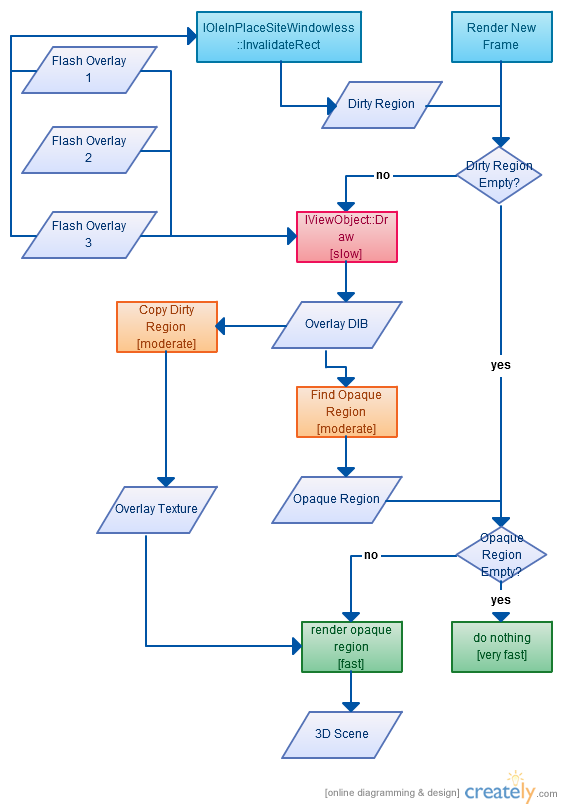
  • When a SWF updates regions of the frame buffer, it notifies you through IOleInPlaceSiteWindowless::InvalidateRect.

In addition, we’d like the Flash overlay system to fit within these performance constraints:

  • Each SWF is rendered over the entire window. For example, implementing a ball that bounces around the screen or a draggable UI component should not require any special IMVU APIs.
  • If a SWF is not animating, we do not copy its pixels to the GPU every frame.
  • We do not render the overlay in transparent regions. That is, if no Flash content is visible, rendering is free.
  • Memory consumption (ignoring memory used by individual SWFs) for the overlay usage is O(framebuffer), not O(framebuffer * SWFs). That is, loading three SWFs should not require allocation of three screen-sized textures.
  • If Flash notifies of multiple changed regions per frame, only call IViewObject::Draw once.

Without further ado, let’s look at the fast algorithm:

Flash notifies us of visual changes via IOleInPlaceSiteWindowless::InvalidateRect. We take any updated rectangles and add them to a per-frame dirty region. When it’s time to render a frame, there are four possibilities:

  • The dirty region is empty and the opaque region is empty. This case is basically free, because nothing need be drawn.
  • The dirty region is empty and the opaque region is nonempty. In this case, we just need to render our cached textures for the non-opaque regions of the screen. This case is the most common. Since a video memory blit is fast, there’s not much we could do to further speed it up.
  • The dirty region is nonempty. We must IViewObject::Draw into our Overlay DIB, with one tricky bit. Since we’re only storing one overlay texture, we need to render each loaded Flash overlay SWF into the DIB, not just the one that changed. Imagine an animating SWF underneath another translucent SWF. The top SWF must be composited with the bottom SWF’s updates. After rendering each SWF, we scan the updated DIB for a minimalish opaque region. Why not just render the dirty region? Imagine a SWF with a bouncing ball. If we naively rendered every dirty rectangle, eventually we’d be rendering the entire screen. Scanning for minimal opaque regions enables recalculation of what’s actually visible.
  • The dirty region is nonempty, but the updated pixels are all transparent. If this occurs, we no longer need to render anything at all until Flash content reappears.

This algorithm has proven efficient. It supports multiple overlapping SWFs while minimizing memory consumption and CPU/GPU draw calls per frame. Until recently, we used Flash for several of our UI components, giving us a standard toolchain and a great deal of flexibility. Flash was the bridge that took us from the dark ages of C++ UI code to UI on which we could actually iterate.

How to Embed Flash Into Your 3D Application

By Chad Austin

Writing user interfaces is hard. Writing usable interfaces is harder. Yet, the design of your interface is your product.

Products are living entities. They always want to grow, adapting to their users as users adapt to them. In that light, why build your user interface in a static technology like C++ or Java? It won’t be perfect the first time you build it, so prepare for change.

IMVU employs two technologies for rapidly iterating on and refining our client UIs: Flash and Gecko/HTML. Sure, integrating these technologies has a sizable up-front cost, but the iteration speed they provide easily pays for them.

Rapid iteration has some obvious benefits:

  1. reduces development cost
  2. reduces time to market

and some less-obvious benefits:

  1. better product/market fit: when you can change your UI, you will.
  2. improved product quality: little details distinguish mediocre products from great products. make changing details cheap and your Pinto will become a Cadillac.
  3. improved morale: both engineers and designers love watching their creations appear on the screen right before them. it’s why so many programmers create games!

I will show you how integrating Flash into a 3D application is easier than it sounds.

Should I use Adobe Flash or Scaleform GFx?

The two most common Flash implementations are Adobe’s ActiveX control (which has a 97% installed base!) and Scaleform GFx.

Adobe’s control has perfect compatibility with their tool chain (go figure!) but is closed-source and good luck getting help from Adobe.

Scaleform GFx is an alternate implementation of Flash designed to be embedded in 3D applications, but, last I checked, is not efficient on machines without GPUs. (Disclaimer: this information is two years old, so I encourage you to make your own evaluation.)

IMVU chose to embed Adobe’s player.

Deploying the Flash Runtime

Assuming you’re using Adobe’s Flash player, how will you deploy their runtime? Well, given Flash’s install base, you can get away with loading the Flash player already installed on the user’s computer. If they don’t have Flash, just require that they install it from your download page. Simple and easy.

Down the road, when Flash version incompatibilities and that last 5% of your possible market becomes important, you can request permission from Adobe to deploy the Flash player with your application.

Displaying SWFs

IMVU displays Flash in two contexts: traditional HWND windows and 2D overlays atop the 3D scene.

If you want to have something up and running in a day, buy f_in_box. Besides its awesome name, it’s cheap, comes with source code, and the support forums are fantastic. It’s a perfect way to bootstrap. After a weekend of playing with f_in_box, Dusty and I had a YouTube video playing in a texture on top of our 3D scene.

Once you run into f_in_box’s limitations, you can use the IShockwaveFlash and IOleInPlaceObjectWindowless COM interfaces directly. See Igor Makarav’s excellent tutorial and CFlashWnd class.

Rendering Flash as an HWND

For top-level UI elements use f_in_box or CFlashWnd directly. They’re perfectly suited for this. Seriously, it’s just a few lines of code. Look at their samples and go.

Rendering Flash as a 3D Overlay

Rendering Flash to a 3D window gets a bit tricky… Check out my next post!

Agile Business Intelligence: A Core Component of Agile Engineering

By Curtis Pullen

Business intelligence (BI) is not a term that is frequently brought up in the context of agile development – it seems more appropriate in the context of big, slowly moving companies crunching data on million dollar mainframes. The truth, however, is that business intelligence is a critical and integral part of the agile product development process. The goal of agile is to enable teams to react to feedback, and the goal of business intelligence is to provide that feedback.

Business intelligence in the traditional sense is unfortunately not equipped to provide the kind of feedback that an agile engineering team needs. When multiple teams of engineers are iterating in two or three week sprints, continuously deploying their changes to a production system as we do at IMVU, BI needs to be even faster. Those engineers are inventing new dimensions of potential analysis at an explosive rate and transforming user behaviour so quickly that data more than a few months old is of only archaeological interest, and to maintain that pace they need continuous feedback. They need to know when a mistake has been made so they can fix it; they need to know when they’re on to something revolutionary so they can run with it. They need BI that’s as agile as they are.

So what does agile BI look like? It employs many of the same patterns as agile software development: quick iteration, frequent releases, and close communication. While a feature is under development, BI analysts meet with product management to identify the high-level metrics that will best indicate the status of the project post-release, and with engineers, to determine how that data might best be obtained. When a project ships, BI analysts aggregate the data, translate it into meaningful information, present it, and seek feedback. Any questions or concerns raised by engineering or management trigger a new round of the cycle:

1. Discuss requirements with stakeholders.

2. Collect and interpret data

3. Deliver results to stakeholders and collect feedback

In order for this to succeed, BI needs to be tightly linked to both engineering and management. At IMVU, we accomplish this by having our engineers take on most of our BI work as an integral part of product development, while more sophisticated analysis is undertaken by a BI team with engineering support. We collect the right data exactly when we need it, we don’t waste time scrutinizing obvious patterns, and we illuminate the details as soon as it’s necessary.

Life moves fast, business intelligence should too.

This is an expanded version of some thoughts I put down in a contest for how best to describe agile BI. You can read the entries and then vote for mine here: http://www.pentaho.com/what_is_agile